NetworkMonitor
Precision control, network at ease.
Simple, precise, fast — cross-platform PING monitoring, speed test, router access and professional network analysis.
 Android
 iOS
iOS HarmonyOS
 Windows
 macOS
macOS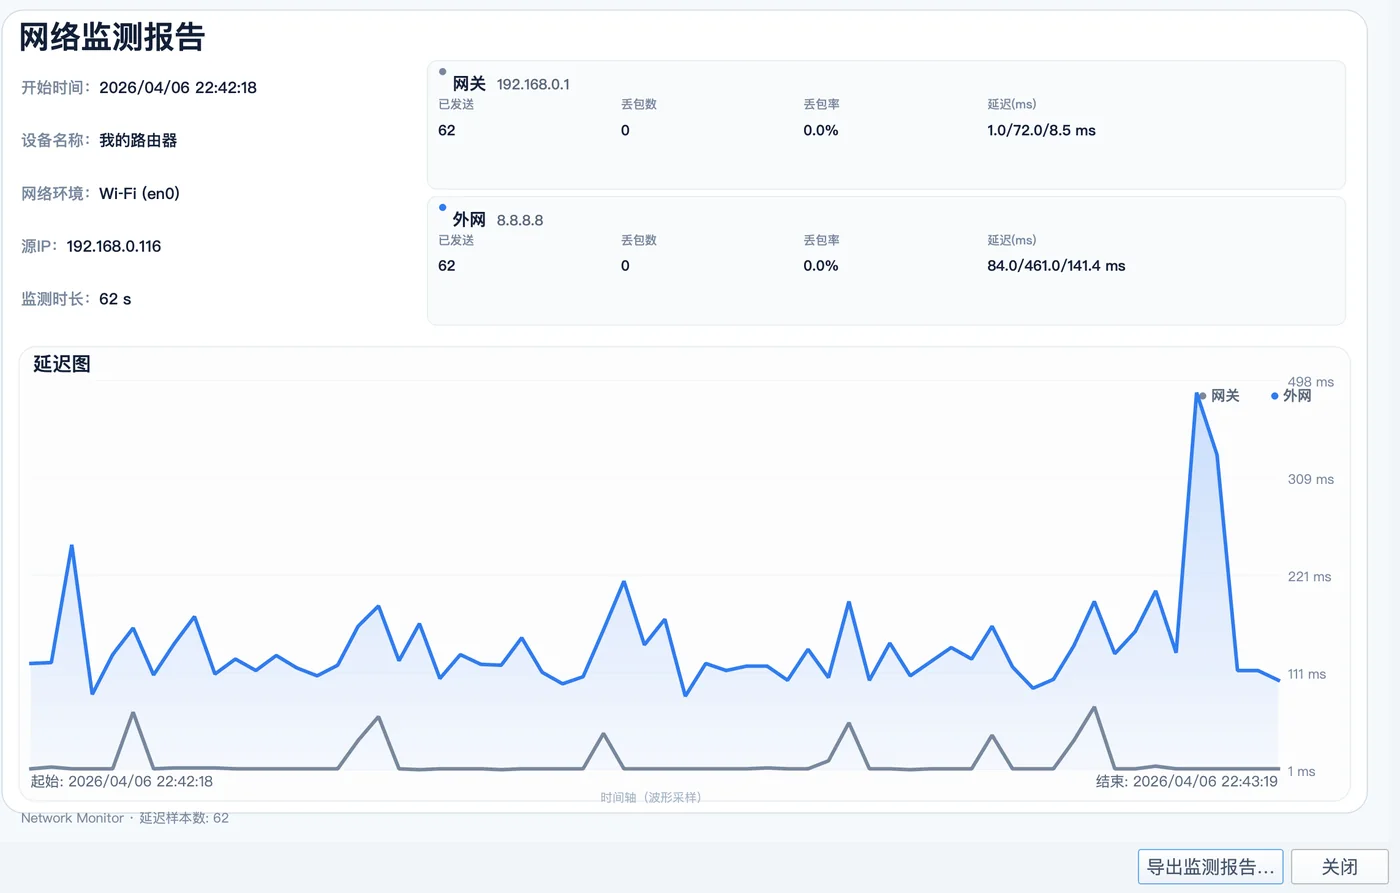
* Desktop currently supports every feature described on this page
A beautiful PING monitor
3-level smart alerts
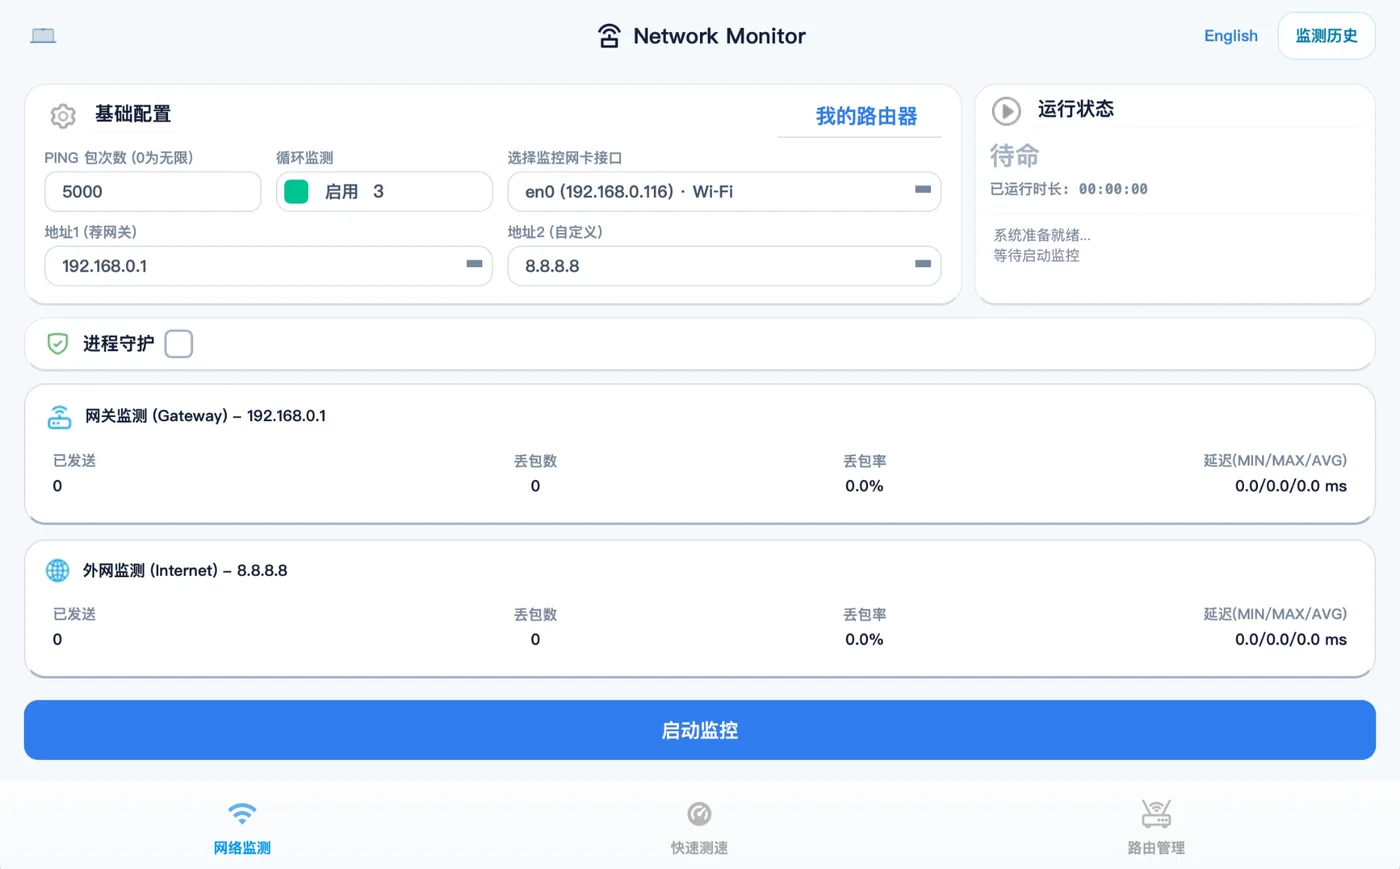
Watch the pulse of your network with ECG-like precision. Set your own targets and PING counts; a built-in three-level alert engine catches any anomaly the moment it happens — from home broadband troubleshooting to office network checks.
- Loss ≤ 1.0% — excellent, all green
- Loss > 1.0% — orange warning
- Loss > 5.0% — red alarm
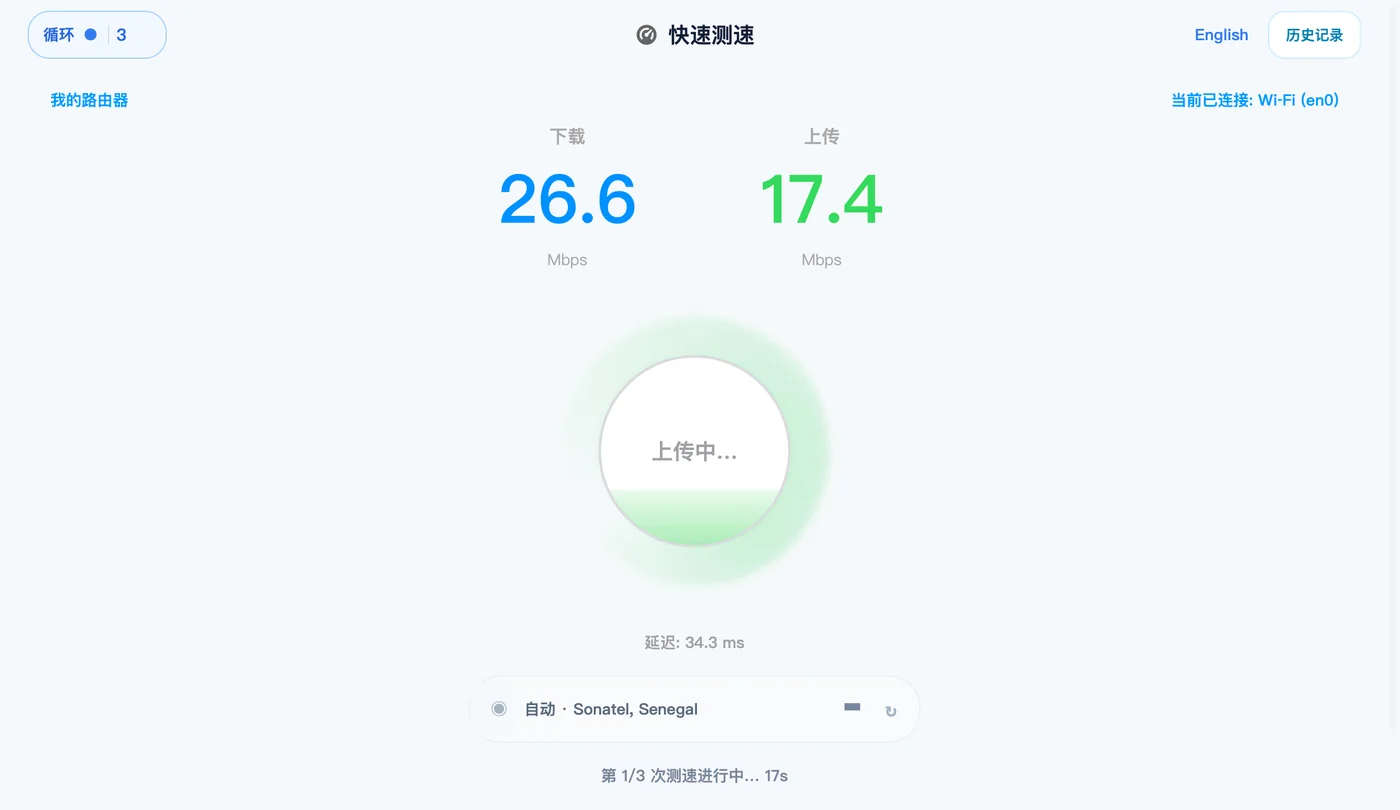
Instant bandwidth test
Real data, instant results
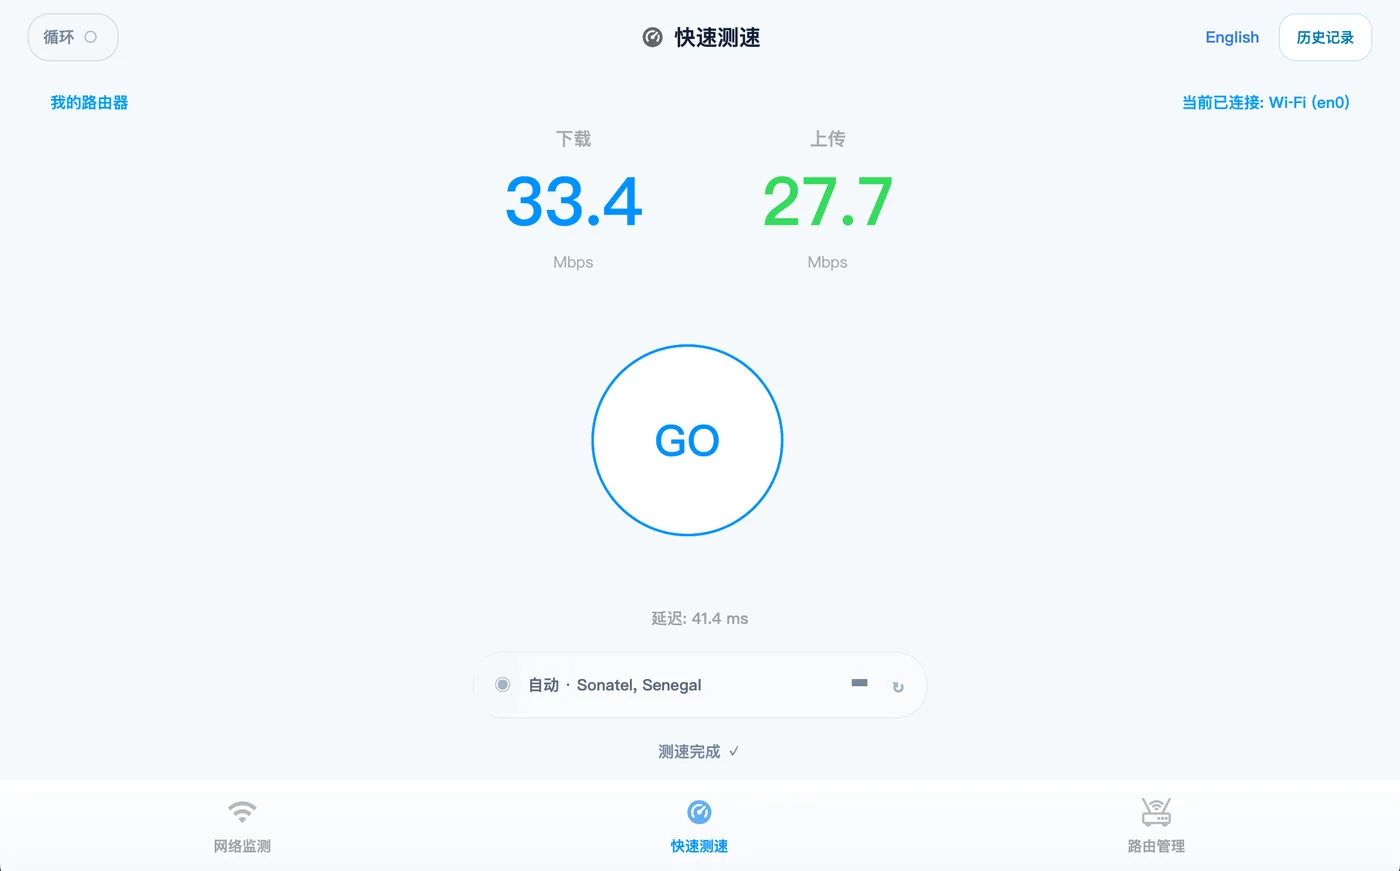
Measure real up/down bandwidth fast, and leave ad-filled third-party speed sites behind. A light probe starts in one tap and returns in seconds without hogging system resources — bottlenecks have nowhere to hide.
- Downlink / uplink bandwidth and live latency
- Light probe, one-tap start
- No ads, no third-party pages
One-tap router access
Smart LAN gateway detection
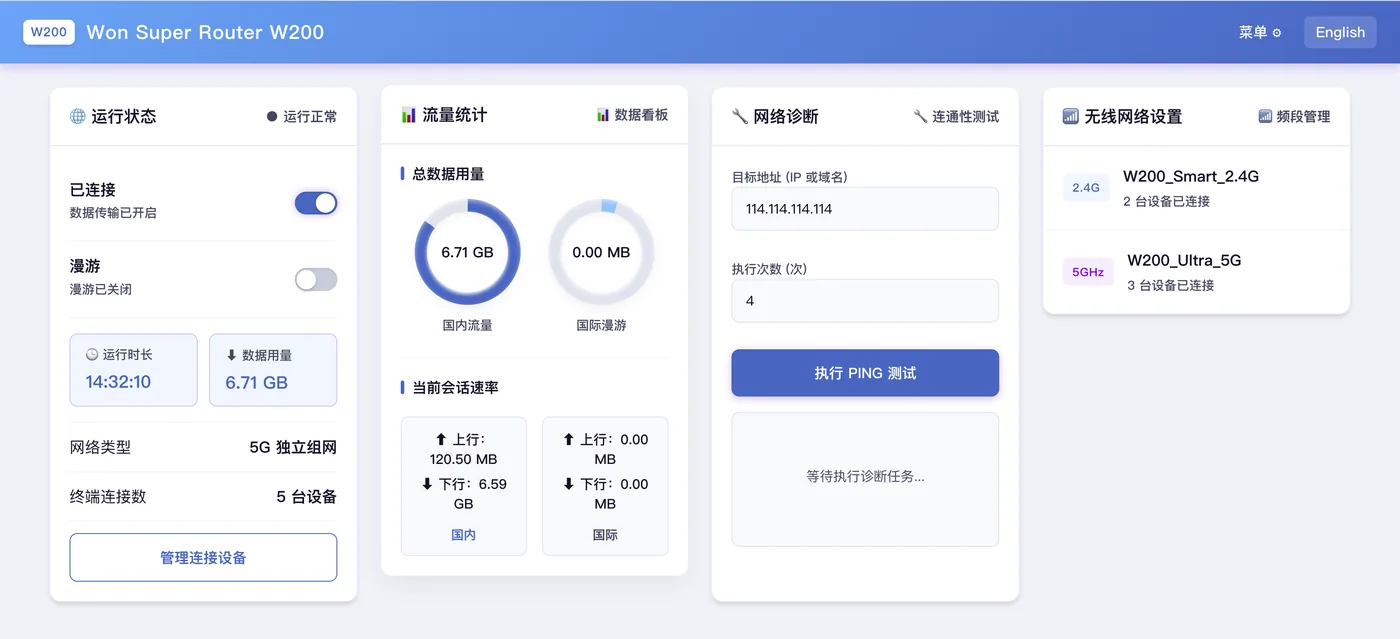
The current LAN gateway is detected automatically, and one tap jumps straight to your CPE or router web console — no more hunting for IP addresses.
- LAN gateway detected automatically
- One tap to the device web console
- Clean experience: no notification noise
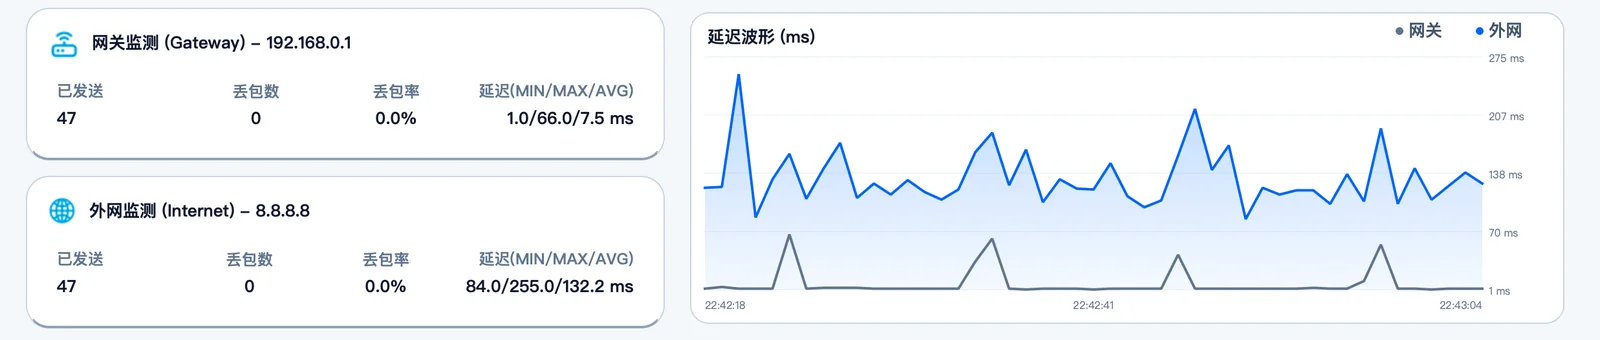
Live PING latency
The curve says it all
A dynamic latency curve, refreshed in real time at millisecond precision. Jitter patterns become obvious and hidden fluctuations visible — the clearest visual basis for diagnosis and root-cause tracing.
- Millisecond latency curve rendered live
- Jitter and peaks clearly shown
- Pinpoints network faults
Process daemon · capture linkage
Catch the exact moment of failure
A background daemon keeps monitoring stable for the long haul. It links with Wireshark, tcpdump and other capture tools: when an outage is detected, capture stops automatically and the exact scene is preserved — no more digging through mountains of packets.
- Daemon: monitoring is not interrupted by system reclaim.
- Linked stop: capture halts the moment an outage is seen, locking in the faulty packets.
- Precise review: skip the noise and go straight to the heart of the anomaly.

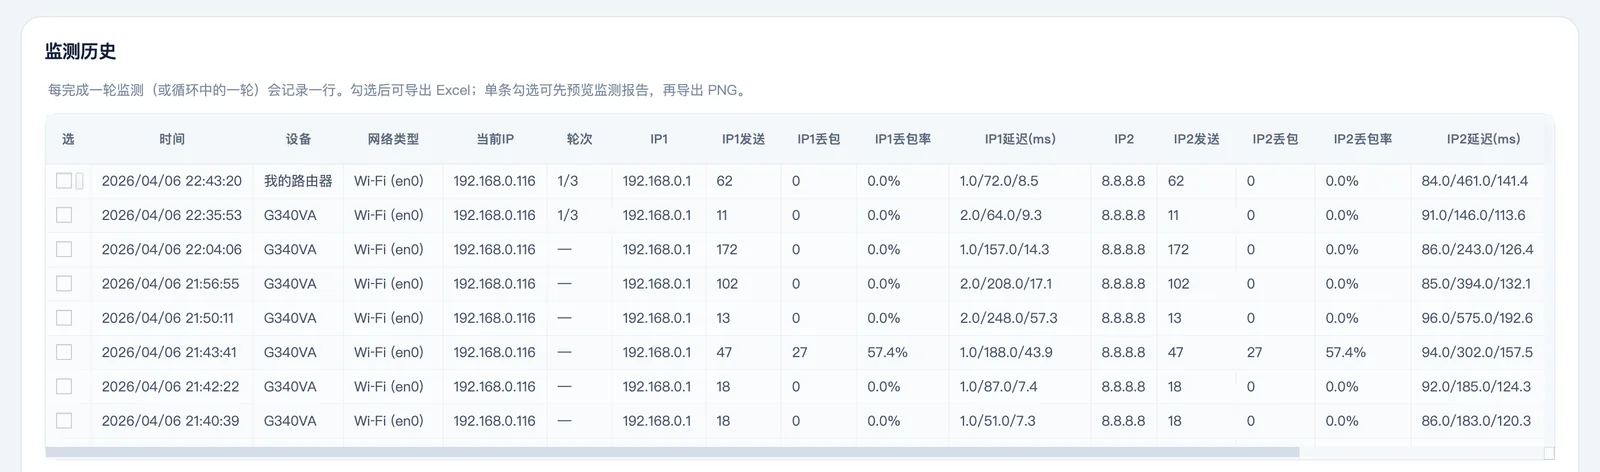
Monitoring history
Kept for good, ready to revisit
Every monitoring run is saved in full and laid out on a timeline. Compare network quality across time, track recurring faults — stored locally, private, no cloud dependence.
- Every run recorded on a timeline
- Compare quality trends across periods
- Stored locally — private and safe
One-click visual report
Data with professional polish
Turn monitoring data into a professional report instantly, exported to Excel with the built-in charts intact. For periodic network reviews or IT status reports, you get a high-quality document fast.
- Visual fidelity: charts survive export untouched, no rework.
- Efficient review: trends and performance of the period, organised fast.
- Deep archive: standard documents for IT maintenance and tuning.
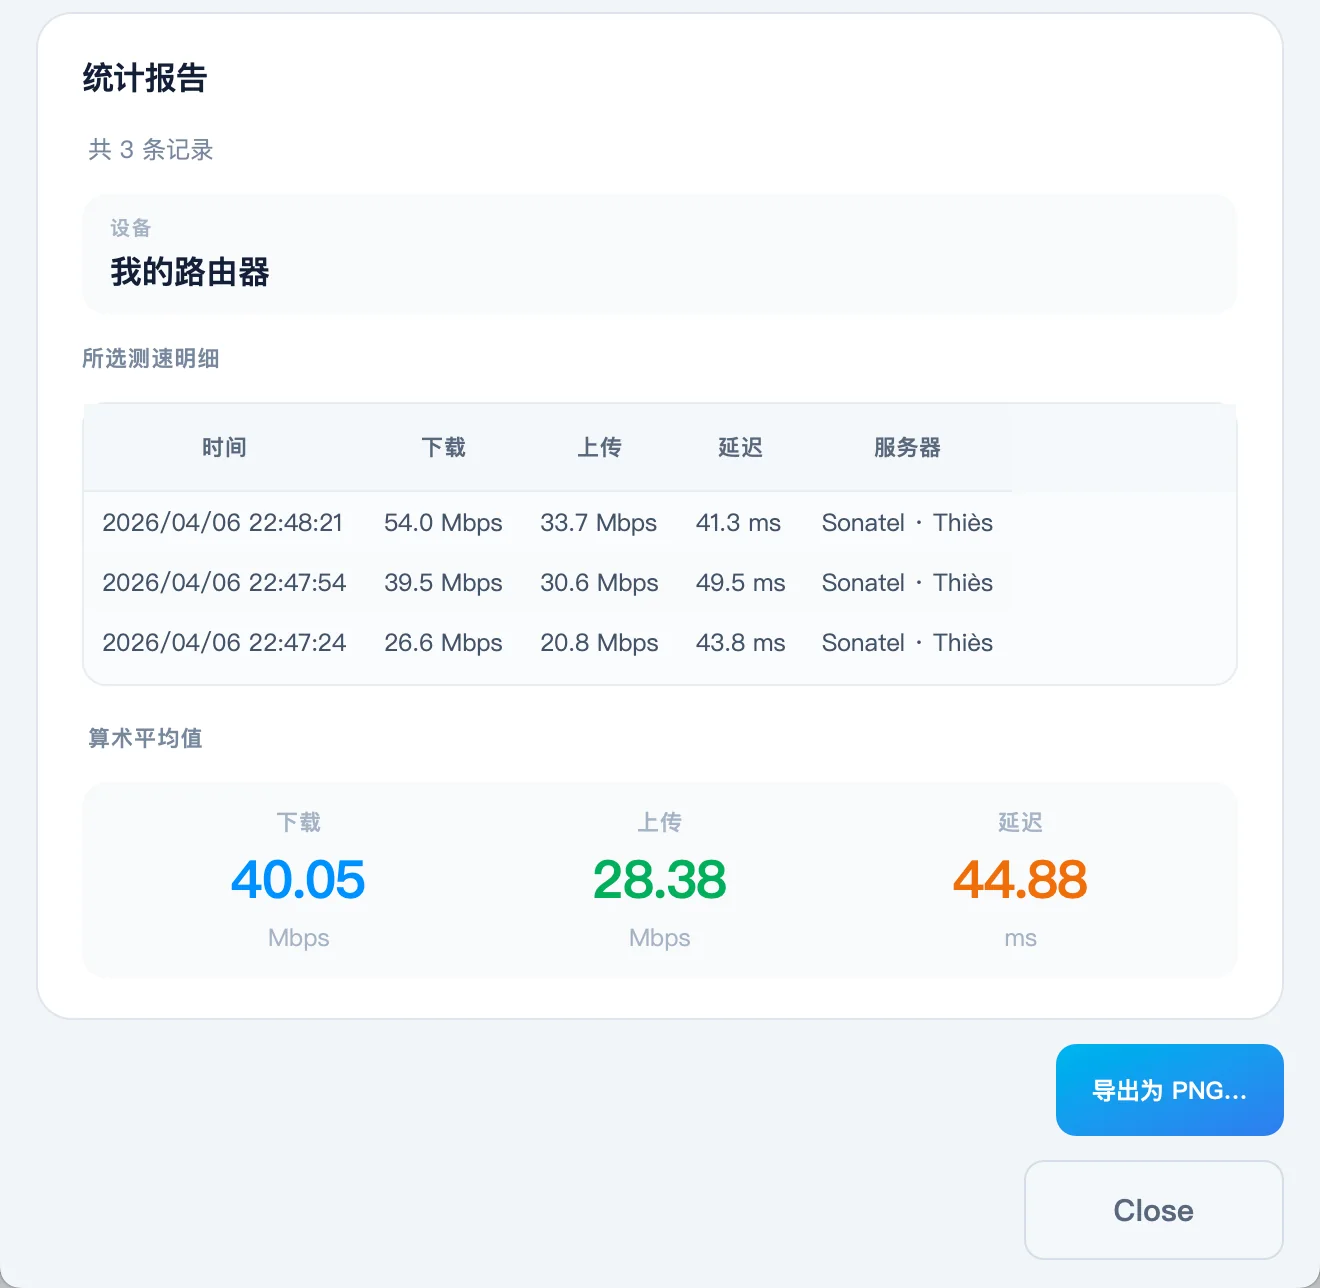
Multi-PING benchmark
Measure stability precisely
Run a custom number of consecutive PINGs to remove single-shot noise. Min / average / max latency and loss are computed automatically, and a full benchmark report exports in one click.
- Custom run count removes random error
- Min / avg / max latency and loss statistics
- One-click full benchmark report
Live statistics engine · specs
- Target
- Fully user-defined
- Warning threshold
- Loss > 1.0% → orange warning
- Critical threshold
- Loss > 5.0% → red alarm
- Latency precision
- Millisecond (1 ms)
- History
- Stored locally, no cloud dependence
- Platforms
- Android · iOS · HarmonyOS · Windows · macOS
Choose your edition
From basic monitoring to a professional toolkit — find the tier that fits.
Pricing goes live with the official release.
Free
For everyday personal network monitoring
Free forever
- Live network PING monitoring
- Bandwidth speed test
- One-tap router access
- Android / iOS / Harmony mobile
- Monitoring history
- Report export
- AI network analysis
Plus
For power users and small teams
Lifetime license · per device
- Everything in Free
- LAN device scan
- Network usage details
- IP traceroute
- Monitoring history
- Excel chart export
- Looped monitoring / speed test
- Multi-NIC PING
- Choose speed-test server
- AI network analysis
- Early access to betas
Pro
For multi-device professionals and teams
Lifetime license + ¥9/month subscription
- Everything in Plus
- Live PING latency curve
- Daemon + capture linkage
- Windows / macOS desktop
- Multi-device cloud monitoring
- OpenClaw integration
- Early access to betas
| Feature | Free | Plus | Pro |
|---|---|---|---|
| Network monitoring | |||
| Live network status | ✓ | ✓ | ✓ |
| Monitoring history | ✗ | ✓ | ✓ |
| Excel chart export | ✗ | ✓ | ✓ |
| Scheduled looped monitoring | ✗ | ✓ | ✓ |
| Live PING latency curve | ✗ | ✗ | ✓ |
| Custom PING parameters | ✗ | ✗ | ✓ |
| LAN device scan | ✗ | ✓ | ✓ |
| Network usage details | ✗ | ✓ | ✓ |
| IP traceroute | ✗ | ✓ | ✓ |
| Speed test | |||
| Network speed test | ✓ | ✓ | ✓ |
| Choose server node | ✗ | ✓ | ✓ |
| Multi-NIC PING | ✗ | ✓ | ✓ |
| Professional iPerf test | ✗ | ✗ | ✓ |
| Platforms | |||
| Android / iOS / Harmony mobile | ✓ | ✓ | ✓ |
| Windows / macOS desktop | ✗ | ✗ | ✓ |
| Cloud | |||
| Cloud data sync | ✗ | ✓ | ✓ |
| Multi-device cloud monitoring | ✗ | ✗ | ✓ |
| Early access to betas | ✗ | ✓ | ✓ |
| AI | |||
| AI network problem analysis | ✗ | ✓ | ✓ |
| OpenClaw integration | ✗ | ✗ | ✓ |
Product roadmap
What is done, what is underway and what is planned — at a glance.
Done
July 2026 major release
- Upstream gateway monitoring ported to iOS / HarmonyOS
- Forced-update flow unified across three clients
- iOS upgrade entry completed (silent check on launch + green dot + detail card)
- PING curves added on all three clients (live + history detail)
- Starfield v4 performance work ported to Android / HarmonyOS
- License codes summarised
- Code-quality clean-up on all three clients
In progress
Underway
Nothing public in progress right now. New progress will appear here first.
Planned
TBD · not scheduled
- Multi-device management
Device list and detail aligned across clients - One-tap speed report
Generate a complete speed report in one tap - AI network analysis
AI-assisted analysis of monitoring data
* Planned items are not scheduled; release timing follows official updates.
Five platforms, one experience
Android · iOS · HarmonyOS · Windows · macOS
Mobile
Android
Native performance, no background nagging, with keep-alive and continuous background PING.
Get APKOlder v3.3iPhone · iPad
Fully tuned for Apple silicon with a smooth interface and every mobile feature.
Get on the App StoreHarmonyOS
Native to the HarmonyOS ecosystem, tuned for Huawei devices and smooth on HarmonyOS NEXT.
Open AppGalleryDesktop
Windows Desktop
Built on Python for speed, with live latency curves, process daemon, capture linkage and the full Pro feature set.
Download .exe installermacOS Desktop
Native on Apple silicon Macs, notarised by Apple so it opens directly; a much smaller package that runs light.
Download .dmg installerAndroid release notes
- Live latency curve added; both IPs’ latency visible during monitoring
- History detail is now a full page with loss, jitter and more
- Upstream gateway monitoring added; steadier on mobile networks
- Smoother, more accurate speed test
- New navigation bar style
- Check-for-updates added with one-tap install
- Update check on launch with a green dot
- Rounded update dialog and full haptic feedback
- Refined interface with a cleaner experience
- Background PING and keep-alive
- Looped PING monitoring
- Full dark-mode support
- Custom PING address and count
- Quick network speed test